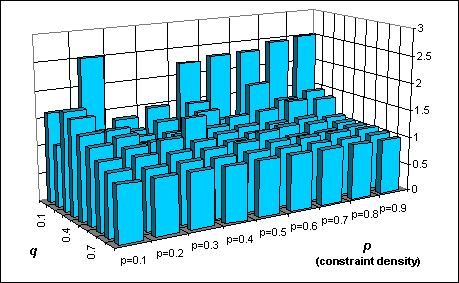
 This
graph represents the ratio of the number of constraint checks performed
by Forward Checking and Interactive Forward Checking (the higher the bars,
the better the interactive approach). The test was performed generating
a number of problems with n=10, m=10 varying the probabilities
p and q in the range from 10% to 90% with a step of 10%.
Each bar represents the average of 20 problems. We can see that the number
of constraint checks for the interactive method is always less than
plain forward checking (the bars are higher than 1), and it is considerably
lower if the constraints are tight (i.e. low values for q). This
depends on the fact that when we perform acquisition, we extract only the
values consistent with an interactive constraint.
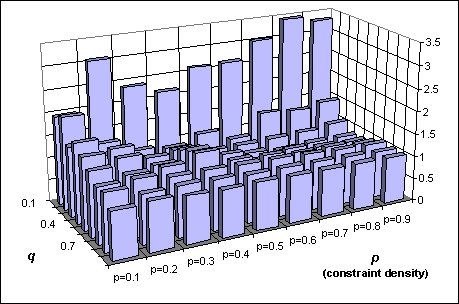 This
graph shows the ratio of the number of constraint checks in Minimal Forward
Checking and Interactive Minimal Forward Checking. The parameters are the
same as in the previous graphic. In this case the number of constraint
checks can be higher for the interactive method, but it greatly outperforms
the non interactive when the constraints are very tight.
This
graph shows the ratio of the number of constraint checks in Minimal Forward
Checking and Interactive Minimal Forward Checking. The parameters are the
same as in the previous graphic. In this case the number of constraint
checks can be higher for the interactive method, but it greatly outperforms
the non interactive when the constraints are very tight.If the extraction process is computationally expensive (as it usually is), the number of extracted elements is a better indicator than the number of constraint checks. If the extractin process is significanlty hard, then it may be a good idea to remember all the extracted elements, in order to avoid re-extraction of previously acquired values. The space complexity of such a record depends on the meaning of the computation domains. If each retrieved value is meaningful for each variable domain (e.g. in the vision system every segment is meaningful for each edge of a rectangle), then the space complexity is O(m). On the other hand, a value may bear different meanings when bound to different values; in this case a record must be kept for each extracted element for each variable and the space complexity is O(nm). Since the space complexity of Forward Checking is O(nm), and it's O(n2m) for Minimal Forward Checking, the added complexity does not affect the overall space complexity.
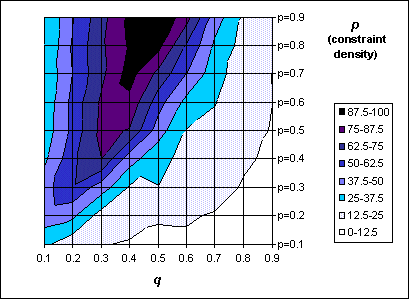 In our simulations, we considered the worst case, when a record of each
extracted element must be kept for each variable.
In this graph, we show the percentage of extracted elements for Interactive Minimal Forward Checking; the darker the color, the higher the number of extracted elements. We can see that in more than half the cases, the number of extracted elements was less than 50% the elements extracted by CSP methods. If the constraints are very tight, the number of extractions is very low, because every interactive constraint will acquire only few values, and this will be enough to demonstrate that the whole problem is insoluble. On the other side, the number of extracted elements decreases even if there are few constraints (low values for p) and if the constraints are very loose (high values for q).
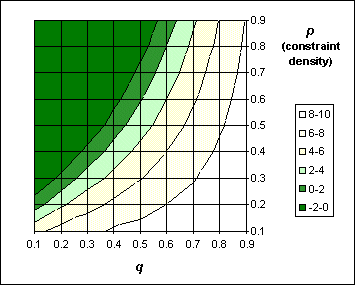 This fact can be explained comparing the last graph with the number of
expected solutions, shown in this graph, calculated as in [DM94].
In this graph, the number of expected solutions is in logarithmic scale;
notice that in the bottom-right edge the number of expected solutions grows
up to 1010. The two graphs seem to have the same behaviour
in the bottom-right corner, where the number of solutions grows. If the
number of solutions is high, then it's likely that a given extracted value
for the first variable is part of a solution, so there wiill be no need
for backtracking and acquiring another value. Since backtracking will probably
happen only in the assignments of the last variables, we'll acquire only
one value for each of the first variables, and the number of extractions
will be kept low.
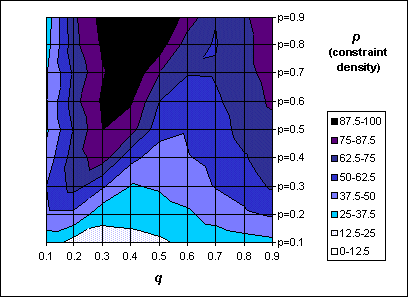 This graph
shows the percentage of elements extracted by Interactive Forward Checking;
we can see that the graph is very similar to the former one, but has a
higher number of acquisitions when q grows. This depends on the
fact that we decided to acquire all the values consistent with an interactive
constraint; if the constraint is very loose, we will acquire nearly every
possible element.